The Horace experiment on the ET-SoC-1
Horace He's post "Strangely, Matrix Multiplications on GPUs Run Faster When Given 'Predictable' Data!" (April 2024) found that an A100 multiplies matrices of zeros about 15% faster than random ones (295 against 257 TFLOPS): predictable data flips fewer transistors, draws less power, and a power-limited GPU then clocks higher. On this chip the whole chain can be taken apart, because the RTL of its multiply-add unit is open. At the same clock and the same 9.2 TFLOPS, a matmul draws 38 W on zeros, 47 W on ones and 63 W on random values, and heats the die in proportion: 1, 27 and 76 thousandths of a degree per trillion FLOPs. Simulating the chip's own multiply-add RTL on the operands the card ran explains the watts: register bits clocked and nets toggled predict the board power of 14 patterns to ±0.5 W, including six patterns whose power was written down before they had ever run. A two-stage thermal network then turns watts into the temperature curve to about 0.3 °C, the resolution of the sensor. And from a cool die Horace's speed effect appears too: zeros run at 11.6 TFLOPS and random values at 9.3, because the firmware's governor lets only the cool pattern keep the fast clock. Run for minutes instead of seconds, nothing but zeros lasts: random data takes the die from 80 to 90 °C in 19 to 26 s, ones in about two minutes. A three-line model (flip rates to watts, leakage that grows with temperature, a thermal network) predicts those times from the flip counts. On runs it was not fitted to, the median error is 9% and the worst 23%; at ten minutes it runs 3 to 5 °C hot. It priced 14 structured matrices, from Hadamard to kaleidoscope, to 0.9 W before they ran.
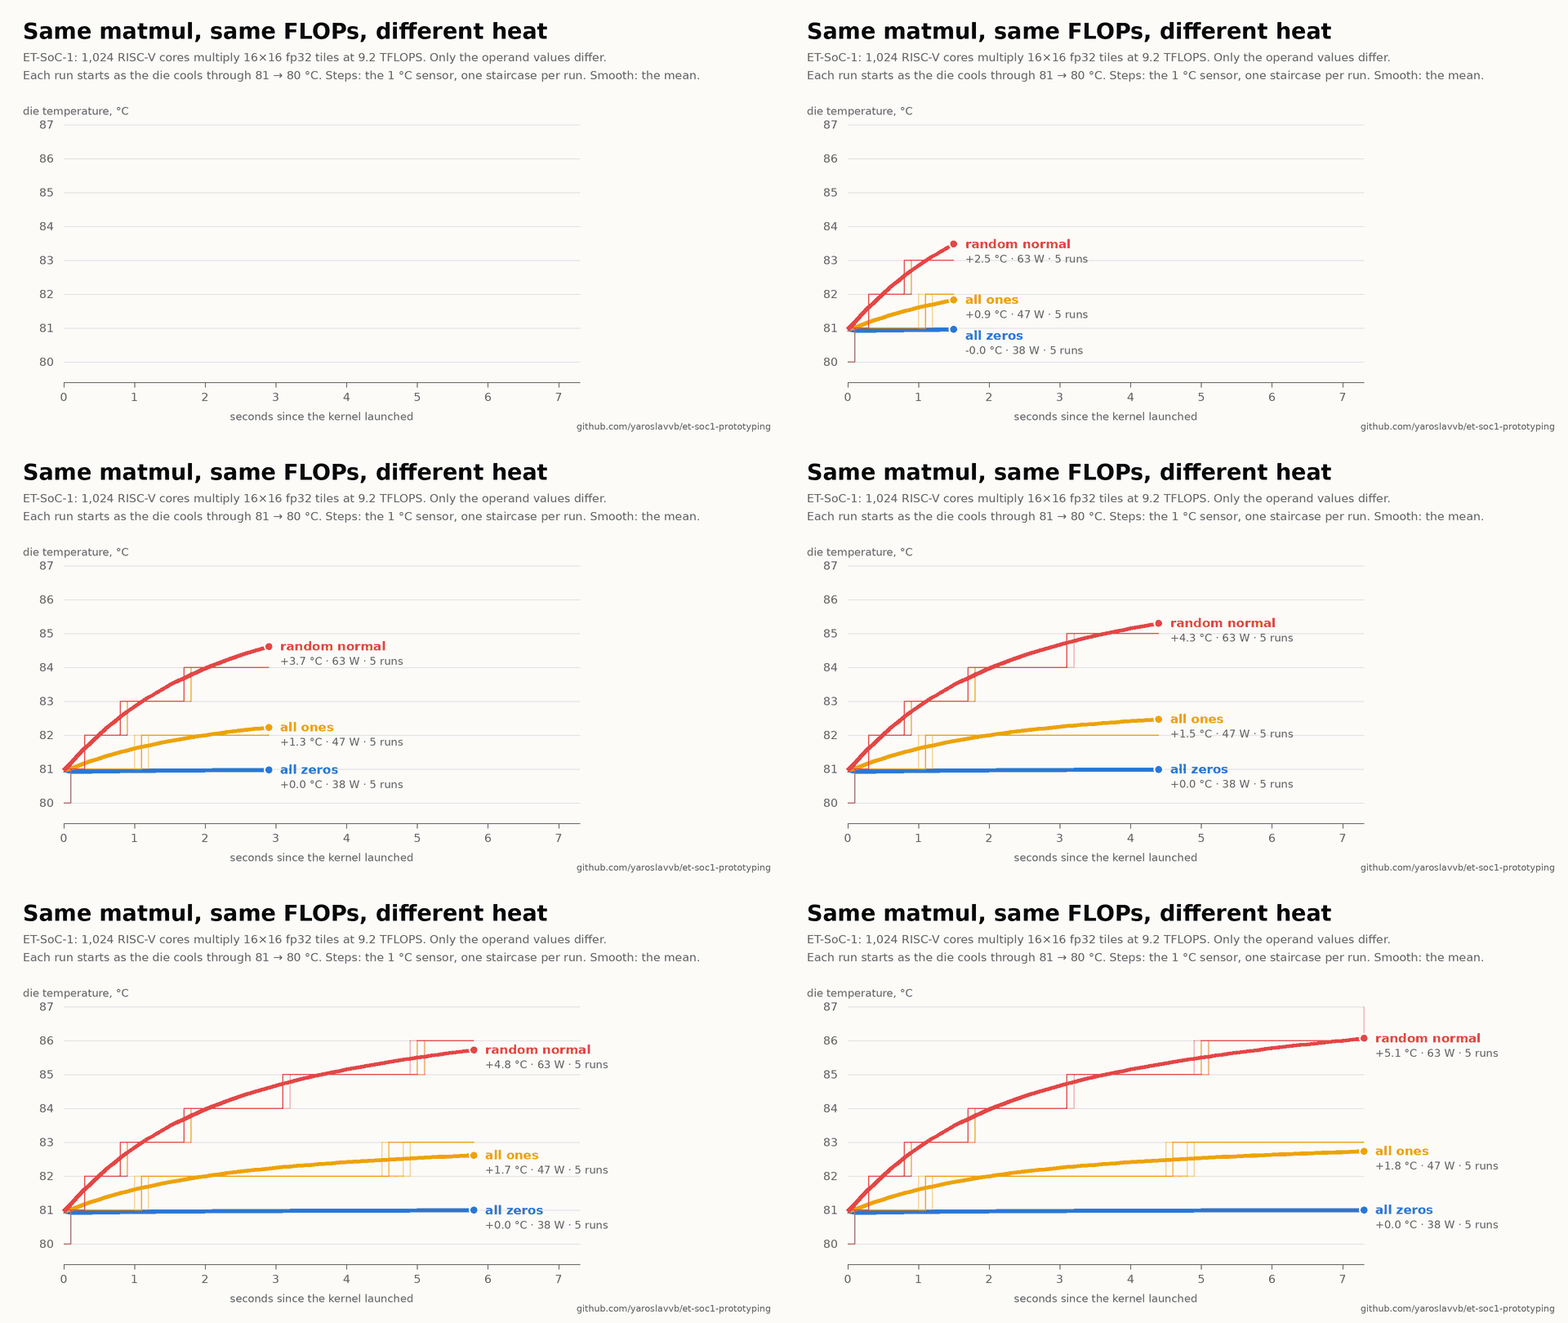
1. Same FLOPs, different heat
All 1,024 minions repeat one 16×16×16 fp32 TensorFMA. Every pattern takes 546.0 cycles per op at
600 MHz, so every run does the same 9.18 × 10¹² FLOPs per second, 6.7 × 10¹³ in its 7.3 s. Only the values in A and B differ.
Six patterns ran five times each; eight more ran twice each for the model in section 3.
- The runs cluster by kind, tightly. Random normal draws 63.40 W with a run-to-run spread of 0.08 W over five different random matrices; zeros 38.29 ± 0.03 W; ones 46.73 ± 0.07 W. The rises of those three repeat to 0.03 °C. Random uniform sits with random normal (61.3 W, +4.7 °C). Ones, π and the half-zero random matrix sit together (46 to 47 W, +1.7 to +1.8 °C). Zeros sit alone at the idle level.
- Heating per FLOP follows power over idle, not total power. Just before each launch the idle card draws 36.3 W and the die is in balance. Zeros add 2.0 W to that and the die gains under 0.1 °C: 1 m°C per 10¹² FLOPs. Ones add 11.6 W: 27 m°C. Random normal adds 30.4 W (the run's average, including the leakage its own heating adds): 76 m°C. The ratio of the last two, 2.8, is the ratio of the added watts, 2.6, within the sensor's resolution.
- In energy, a FLOP costs 4.2 pJ of board energy on zeros, 5.2 pJ on ones and 7.3 pJ on random normal. Over the idle card those are 0.2, 1.3 and 3.3 pJ: the data decides a factor of 15.
- Which bits are random matters. Random signs alone (±1) cost 51.4 W, random exponents alone 52.6 W, random mantissas alone 60.4 W, and all three together 63.4 W. One random operand with the other held at 1 costs 54.3 W when A is the random one and 57.9 W when B is. Section 3 shows why.
- The rails agree on where it goes. Late in the run random normal is 29.6 W above zeros on the board. The minion-core rail's own sensor accounts for 21.5 W of that and the SRAM and mesh rails for 1.0 W between them (they run hotter). The remaining 7 W is on no rail sensor: mostly conversion loss in the regulators, which grows with the current.
2. Strict temperature control
Two things make temperature a confound on this card. Power at the same work rises with die temperature, about 0.8 W per °C on the board (leakage). And the firmware's clock governor has a 65 °C threshold: below it a busy card is clocked up to 800 MHz at 0.62 V, above it the card is held at 600 MHz and 0.52 V (section 6). So every run starts from the same thermal state, well above that threshold:
- Heat. If the die is below 84 °C, 2 s bursts of random-data matmul bring it there.
- Cool along the same curve. The card idles until the mean of the 34 minion-shire sensors first reads 80 °C. Approached from above, that reading is an edge, not a range: the kernel launches within a second of the 81→80 step.
- Run one pattern for 7 s, with 10 Hz telemetry throughout. Each process holds the card for under 10 s.
Four burn-in cycles come first so that the heatsink reaches its periodic state. Patterns then run in shuffled blocks, one run of each per block, and the random patterns get new random tiles in every block: 46 measured runs and 4 burn-in cycles in 58 minutes. Three checks that the control worked:
- Clock and voltage. Every sample of every run reads 600 MHz and 516 to 518 mV on the die.
- Start state. The thermal network of section 4 puts the die at 80.96 °C (in the sensor's units) at the 46 launch instants, with a spread of 0.11 °C. Idle power in the two seconds before launch was 36.29 W with a spread of 0.06 W. Heating and cooling to the launch point took 12 to 120 s (median 63 s), depending on what had run before.
- No drift over the hour. By block, random normal read 63.38, 63.42, 63.46, 63.25 and 63.49 W and rose 5.16, 5.16, 5.10, 5.15 and 5.17 °C; zeros read 38.25 to 38.32 W in all five.
The limit that remains is the sensor: it reports whole degrees. A run's rise read off the sensor is good to about half a degree, so the rises in this report are de-quantised: for each run, one number (the heating power) is fitted so that the thermal network of section 4, started from the launch state and rounded like the sensor, reproduces the run's readings. The times at which the reading steps from one degree to the next carry the information. Power needs none of this: it reads in 10 mW steps.
3. From flips to watts
The power differences come from one place: the fused multiply-add units, eight per minion, one per vector lane. The
open RTL of this core family (core-et) includes that unit (txfma_top, seven pipeline stages) and
the control around it. rtl-sim/fma_toggle runs eight copies under Verilator on the exact operand tiles the card
ran (the host dumps them), in the order the tensor state machine issues them: for each row of B, for each row of A, two
micro-ops of eight c = a·b + c; 512 micro-ops per op. Every result is checked: all 8,192 multiply-adds of two
random-data ops match software bit for bit. Three things in the RTL decide the activity:
- Zero gating. On an accumulate pass,
vpu_ctrl.vwithholds the valid bit from a lane whose A or B operand word is zero (ex_fma_gate_mask; the manual's pseudo-code says the same,if (a != 0 && b != 0)). The unit's pipeline registers are enabled by their stage's valid bit, so a gated lane clocks no register and flips no net. That is the zeros case: nothing in the unit moves. - Clocked registers. A valid multiply-add clocks about 600 register bits per lane on its way down the pipe, whether or not the data changed. That is what a constant costs: ones and π clock the registers and toggle almost nothing. (The checkerboard keeps a quarter of its lanes: a product needs both operands nonzero.)
- Data toggles. Random operands flip about 87 million counted nets per op, 85% of them in the multiplier tree (Booth encoders, carry-save adders, 4:2 compressors). Sign-only or exponent-only randomness leaves that tree still and moves only the exponent path, the aligner and the adder.
The table gives the counts per op for one minion, from the card's own tiles. The model is their weighted sum, with one non-negative energy per kind of event, fitted to the 14 measured powers:
board W = constant + e₁ · register bits clocked + e₂ · toggles in the multiplier tree + e₃ · toggles in the rest of the unit + e₄ · operand-word toggles outside the unit
- It fits to 0.3 W and predicts to 0.5 W. Fitted to all 14 patterns the rms error is 0.32 W over a 25 W range. Refitted 14 times with one pattern left out, the left-out pattern is predicted to 0.50 W rms (the black ticks above). The worst are zeros and random exponents (+0.9 W) and ternary (−0.8 W).
- One energy per toggle does not work. With a single count of all net toggles the error is 2.1 W (2.5 W left out): the multiplier tree holds 85% of the counted toggles of a random multiply and little of its energy. Counted separately, a toggle in the tree costs 0.03 fJ and one in the rest of the unit 0.8 fJ. The count is of named RTL nets. The tree is thousands of one-bit compressor cells whose short local nets are each counted at two or three levels of the hierarchy; the rest of the unit is wide buses, shifters and pipeline registers driving long wires. At 0.52 V, 0.8 fJ per toggle is about 6 fF of switched capacitance.
- Clocking is the cost of a constant. 2.47 million register bits clocked per op at 3.0 fJ each is 8.1 W; ones measure 8.4 W over zeros. The figure includes the clock network behind the registers and the write-back of each result, which scale with it.
- It explains the odd orderings. A random with B = 1 flips 38 million tree nets per op, and A = 1 with B random only 13 million, yet the second draws 3.6 W more: it moves 10.1 million nets in the rest of the unit against 5.9 million, and twice as many operand-word bits. Random signs or exponents leave the tree still (under 0.4 million toggles) and cost 5 to 6 W over ones, all of it in the rest of the unit. A half-zero random matrix gates three quarters of its multiply-adds and still costs as much as ones, because the quarter that runs is fully random.
The test that matters most is above. Six of the patterns were invented for this version, and their power was written
down before any of them had run under the power sampler (predictions_before.json, 06:50 on 21 September; the
first of them ran at 06:59). The predictions came from models fitted to the 20 September data, nine patterns with no single
random field and no single random operand among them, and from tiles drawn in software. The two model forms that split the
toggles were right to 1.3 W rms. The two that do not were wrong by 2.7 and 4.2 W, and by 7.3 W on the pattern that separates
them best.
4. From watts to degrees
The die's temperature follows power through a thermal network. A Foster chain (RC stages in series) with time constants fixed on a grid from 1.5 s to 1,000 s was fitted to the whole hour: board power in, sensor reading out, resistances held non-negative. Two stages carry everything this session can see.
A watt added to the board raises the sensor by 0.10 °C within a couple of seconds (the 1.5 s stage: die and spreader) and by another 0.12 °C over the next half minute (the 10 s stage: package and heatsink base). That is 0.06 °C per W after 1 s, 0.12 after 3 s and 0.16 after 7 s. The slower stages get nothing only because this protocol holds the hour's average power constant; the 20 September session, which did not, put a further 0.11 °C per W at 60 s and beyond. The residual over the hour is 0.28 °C rms, which is what rounding to whole degrees alone would leave (0.29 °C).
With both steps in hand, the chain runs from the RTL to the thermometer with no measurement of the run in between. For each run the network starts from the state the hour's measured power had left it in at launch. From there it is driven by the activity model's power for that pattern (from the fit that left that pattern out), plus 0.81 W for every degree the simulated die has gained: leakage, measured from the drift of power within the hot runs.
The ring in the last chart uses no electrical measurement at all. The sensor's whole degrees hide the size of the rise, but the instants at which it steps are sharp. So for each run one number was fitted: the added power which, put through the network from the launch state and rounded like the sensor, reproduces that run's readings. For the eleven patterns that heat the die by more than a degree, this thermal estimate agrees with the electrical one to 1.0 W rms, with a slope of 0.97 between them: the temperature rise is proportional to the power, and the power follows the counted flips. For the three coolest patterns (2 to 5 W over idle) the reading never leaves 81 °C during a run. That only bounds their rise to below about half a degree; the network predicts 0.3 to 0.8 °C.
5. Where the model is off, and why
- Most of the power is not flips of this computation. Of random normal's 63.4 W, 38.6 W is the model's constant: what the card draws at 80 °C with every multiply-add gated. Idle is 36.3 W of it: leakage (the same idle card draws 26.7 W at 62 °C), always-on clocks, DDR, PCIe and regulator losses. The other 2 W is 1,024 tensor state machines stepping through gated micro-ops. Temperature rises with power over the idle level, so heating per FLOP runs from 1 to 76 m°C while energy per FLOP only runs from 4.2 to 7.3 pJ.
- Register clocking is switching that the data does not control, except by being zero. A constant costs 8.4 W over zeros with almost no net toggles. "Proportional to flips" holds only once clock edges delivered to registers count as flips.
- A counted toggle is not a fixed charge. The fitted energies differ 25-fold between the multiplier tree and the rest of the unit. RTL net counts stand in for capacitance only within blocks of similar structure; a netlist with extracted capacitances would replace three fitted numbers with none. The zero-delay simulation also has no glitches. Real carry-save trees glitch, more so on random data, and the fitted energies absorb the average.
- Leakage feeds back. Random normal reads 65.8 W in seconds 1 to 3 and 68.0 W in the last two seconds of the same run: +2.2 W from its own 5 °C. The model's watts are at the launch temperature, and the chain adds 0.81 W per simulated degree. Without that term it would under-predict the hot patterns' rise by about a tenth.
- The sensor. One whole-degree number stands for the mean of 34 sensors. The thermal fit's residual is the rounding. The launch temperature is known to a few tenths of a degree in absolute terms, the same for every run, which matters only for the three coolest patterns. The hot spots are the multiply-add units, not the sensors, so the junctions that leak are hotter than the reading.
- Board power is not die power. About 7 of random normal's 30 W over zeros never reach the die; they are lost in the regulators. The network was fitted to board power and absorbs that as fewer °C per W. It would not transfer to a workload that loads a different rail.
- What is left. Power: 0.5 W rms out of sample, 0.9 W at worst. Rise: 0.33 °C rms from the RTL alone against 0.30 °C from the measured power. So almost all of the temperature error belongs to the thermal step and the sensor, not to the flips.
6. The speed effect appears on a cool die
Earlier versions of this report said the clock never moves on this card. That was wrong, and the reason is the
point of this section. The service processor runs a governor (thermal_pwr_mgmt.c): while a kernel is running it
steps the minion operating point down if the die is above a software threshold (65 °C) or the board's average power is above
the TDP level (65 W), and up otherwise. This card's operating points are 600 MHz at 0.52 V, 700 MHz at 0.57 V and 800 MHz at
0.62 V. Every run on 20 September started above 72 °C, so the thermal branch held 600 MHz throughout, even at 70 W. After a
night idle the die sits at 62 °C, and the same kernels behave differently:
- Zeros keep the fast clock for nearly the whole run: 800 MHz from about a second after launch for 5 to 6 s, at 39 W, with the die at 64 to 66 °C after 7 s. The governor only starts stepping down in the last second. 11.4 and 11.8 TFLOPS.
- Random normal loses it within a second. At 800 MHz and 0.62 V it draws up to 88 W for an instant, the die passes 65 °C in half a second, and the governor steps down to 700 and then 600 MHz. 9.3 TFLOPS in all three runs, at 55 W: the die is 15 °C cooler than in section 1, which is worth 10 W of leakage.
- Ones hover at the threshold: up to 800 MHz, down at 66 °C, up again as the die falls back to 65 °C. 9.7 TFLOPS.
So on this card predictable data does run faster: 25% for zeros against random values, where Horace measured 15% on an A100. The reason is the one he gave: fewer flips, less power, and a governor that then allows a higher clock. Here the limit that bites first is thermal rather than electrical, and it only applies to a die that starts below 65 °C. A card that has been busy idles above that (72 °C on 20 September, 80 °C in section 1), runs everything at 600 MHz, and shows the effect as heat instead of speed. These seven runs are a demonstration, not a controlled experiment: their start temperatures differ by up to 2 °C, and a die that has just run does not return to 62 °C for many minutes.
7. Minutes instead of seconds
Seven seconds show the first two stages of the heating. To see the rest, the same patterns ran as single processes for up to ten minutes each (the lab's 10-second rule was waived for this), from the same start: heat to 84 °C if below, idle until the sensor first reads 80 °C, launch. A run ends early when the die reads 90 °C, which keeps it inside what this card had already seen (93 °C, 70 W). 29 runs took four hours, because after a hot run the die needs up to six minutes to get back to 80 °C. Some runs used fewer minions per shire, which scales the flip rate without changing the flips themselves.
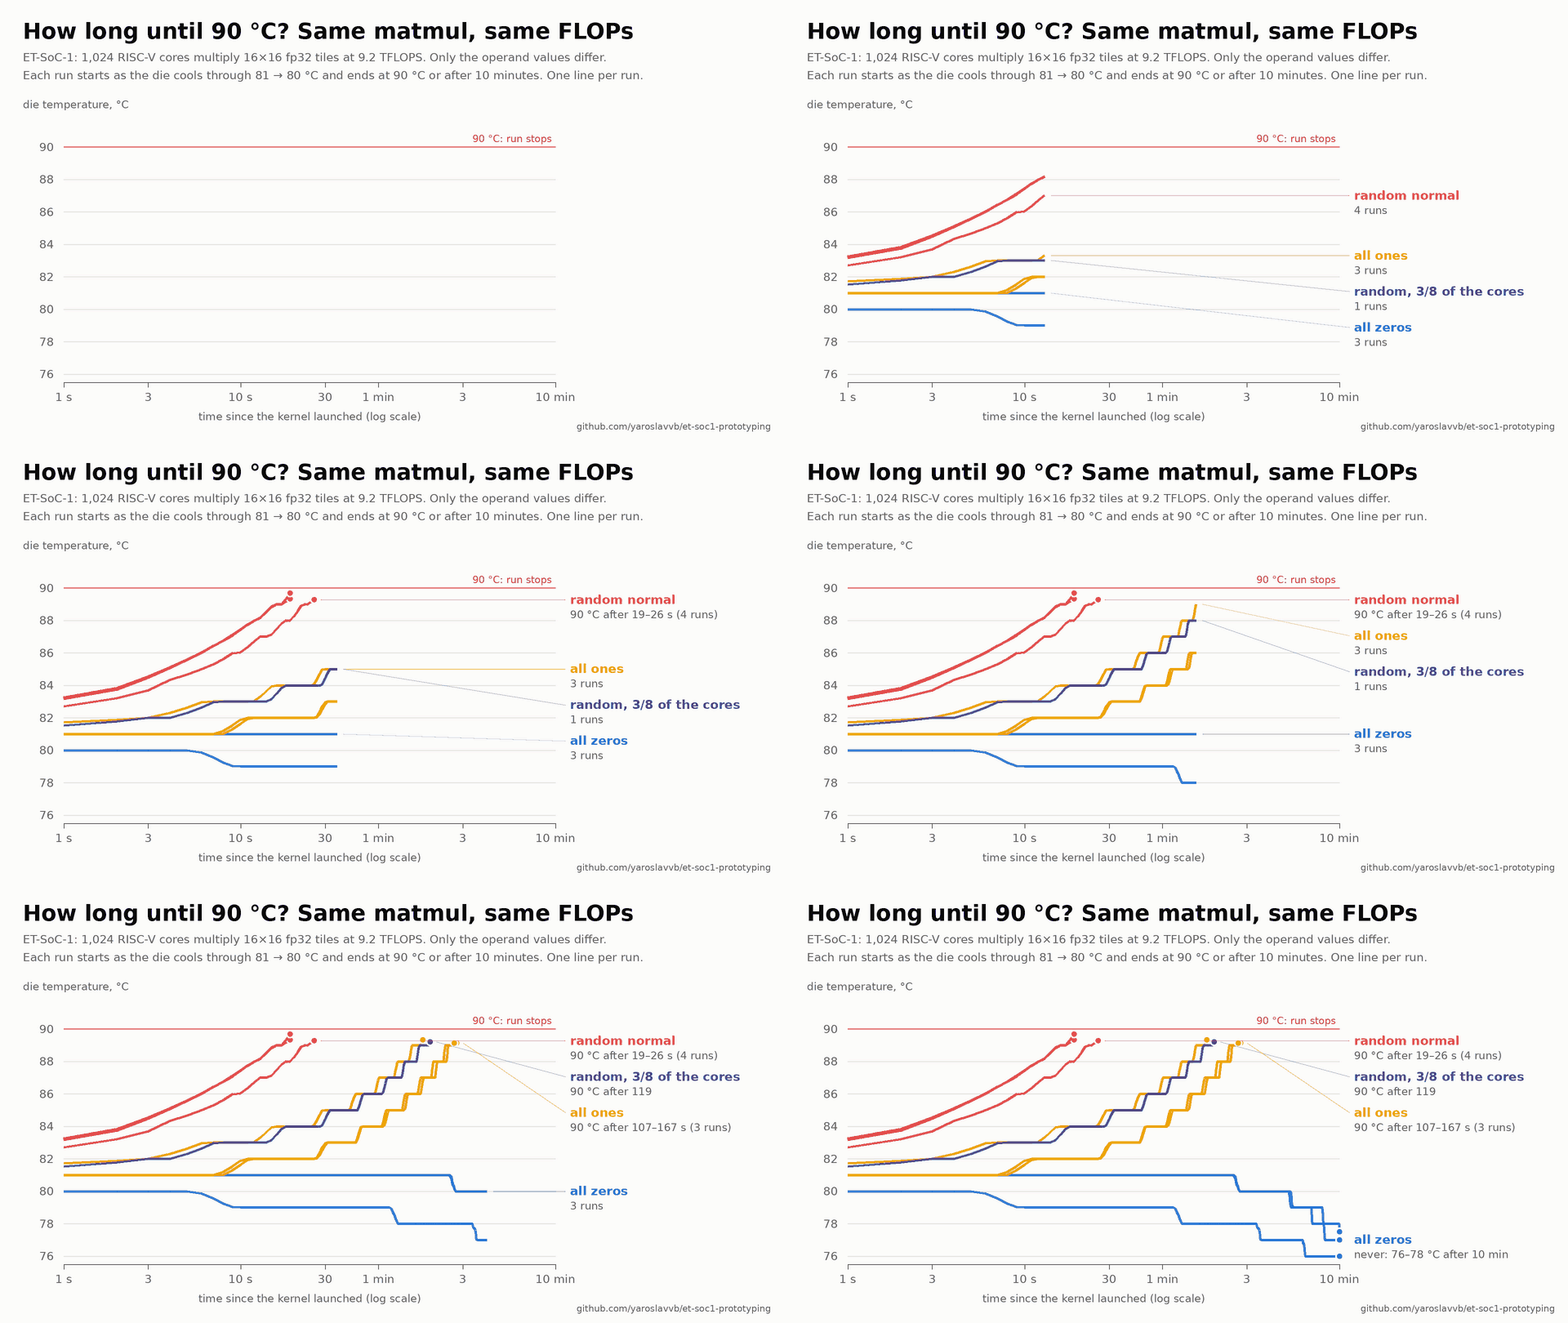
- Nothing but zeros can run for long at full load. Random normal reaches 90 °C in 19 to 26 s (four runs), random uniform in 22 s, random mantissas in 24 s, random signs in 53 s. Ones take 107 to 167 s, π 104 s, and the half-zero random matrix 107 s. Zeros cool the die to 76 to 78 °C over ten minutes, because the heatsink is still shedding the heat of the run before. The checkerboard and the 75%-zero random matrix last the ten minutes but are at 87 °C and rising.
- Fewer cores buy time in proportion to the flips removed. Random normal on 768 cores lasts 35 s, on 512 cores 84 s, on 384 cores 119 s, on 256 cores 276 and 315 s, and on 128 cores it sits at 81 to 82 °C for the whole ten minutes.
- Equal flip power, equal curve. By the flip counts of section 3, ones on all 1,024 cores switch 10.7 W and random normal on 384 cores 10.2 W. The first is all register clocking, the second mostly data toggles, and they heat the die the same: 107 to 167 s against 119 s, with curves that lie on top of each other in the animation.
- The same pattern does not always take the same time. Ones needed 107 s after a hot predecessor and 162 to 167 s after a ten-minute zeros run. Every run starts at the same die reading, but the heatsink behind it does not start in the same state, and over minutes that matters. The model below carries that state.
- During the 28th run the card's cooling changed abruptly: under a constant 42 W the die fell from 84 to 72 °C in four minutes, presumably someone or something changed the airflow in the lab. That run and the one after it are in the chart but not in the fits.
8. A model from flips to temperature
With the long runs the chain of sections 3 and 4 closes into one model that needs only the flip schedule. It has three lines:
flips   F_j(t) = N_j(pattern) × 1.10×10⁶ ops/s × active minions        (four kinds j, from the RTL)
power   P(t)   = 12.6 W + 23.3 W · e^((T−80)/36) + 1.85 W · active/1024 + Σ_j e_j · F_j(t)
heat    T(t)   = 22.8 °C + Σ_k x_k(t),    τ_k · dx_k/dt = R_k · P(t) − x_k

e_j   3.18 fJ   per register bit clocked
      0.025 fJ  per net toggle in the multiplier tree
      0.80 fJ   per other net toggle in the unit
      15.5 fJ   per operand-word bit toggled outside the unit
R_k   0.106 °C/W at 1.5 s · 0.050 at 4 s · 0.234 at 60 s · 0.136 at 150 s
      0.860 at 400 s · 0.081 at 2,500 s                       (sum 1.47 °C/W)
The power line has a fixed part, leakage that grows exponentially with die temperature, the tensor state machines of the active minions, and an energy for each kind of flip. It was fitted to every 10 Hz sample of five hours of sessions: the leakage to the idle samples (rms error 0.20 W from 64 to 88 °C), then the flip energies to the busy samples (0.49 W). The flip energies agree with section 3, which used only seconds 1 to 3 of 46 short runs. The heat line is the thermal network of section 4 with its slow stages now visible; one more number pins the slowest of them, the 62 °C at 26.7 W where this card had settled after a night idle. Driven by the measured power it follows the sensor to 0.63 °C rms over the five hours.
Leakage is two thirds of an idle card's power at 80 °C (23 of 36 W) and it is what makes temperature so sensitive to flips here. Each degree adds 0.65 W, and each watt, given ten minutes, adds 1.2 °C through the network. Closed on itself, that loop has a gain of 0.95 at 80 °C: a watt of switching held for ten minutes raises the die by 3.1 °C, not 1.2, and the gain passes one at 82 °C. The table turns that into degrees per kind of flip for the random fp32 matmul.
How well it fits. For each long run the network is started in the state the measured history had left it in at launch, and then driven by the power line above, with the run's flip rates and its own simulated temperature; nothing measured during the run goes in. The dashed lines in the chart of section 7 are these curves. For the 19 runs that reached 90 °C the time is off by 12% in the median (23 s for 26 s measured, 122 for 119, 326 for 315); the worst is the half-zero random matrix, 157 s for 107 s. For the seven ten-minute runs the end temperature is off by 2.5 °C rms. These are fit numbers: the network and the leakage were estimated from the same session.
How well it predicts. So every parameter was fitted again on the first 7,400 s of the long session (15 runs, plus
the 7-second session of section 2) and frozen, and the 12 later runs were predicted. Nothing is fitted on the held-out part:
the thermal state at each launch comes from an observer that has seen the telemetry up to that launch only
(tools/ettelem/validate_flip_model.py). The held-out runs include four patterns and two core counts that the
thermal fit had never seen.
- Up to a few minutes it predicts as well as it fits: for the seven held-out runs that reached 90 °C the median error is 9% and the worst 23% (ones, 199 s for 162 s); six of the seven are within 20%.
- At ten minutes it runs hot, by 3 to 5 °C on the low-power runs (3.8 °C rms against 2.5 °C in the fit), and it wrongly has two of the five ten-minute runs reaching 90 °C, at 437 and 469 s, when they ended at 87 and 88 °C.
- The slow stages are not pinned down. Between the half fit and the full fit the fast stages and the leakage barely move (0.10 and 0.05 °C/W at 1.5 and 4 s in both; 24.4 against 23.3 W of leakage at 80 °C), but the 400 s stage goes from 0.60 to 0.86 °C/W and the 1,000 s stage from 0.38 to nothing, and the operand-word energy from 20 to 15.5 fJ. The telemetry is 140,000 samples but only 27 runs; that is the number that counts for the slow stages. The overnight idle point that anchors them is a single measurement, assumed to share this session's ambient.
- What does not work at all is letting the model run free for the whole four hours: with a loop gain of 0.95, a 1% error in leakage grows into degrees, and the simulated die drifts away within the hour. The model predicts minutes ahead from a known state.
A predictor for custom workloads. tools/ettelem/predict_heat.py wraps the three lines: give
it the A and B tiles of a workload (or a pattern name), the number of active minions and a start temperature, and it replays
the tiles through the RTL, counts the flips, and prints the switching watts by kind of flip, the board power, the temperature
after 10 s, 1 min and 10 min, the time to a cap, and the duty cycle that would hold the start temperature. Section 9 tests
it on matrices it had never seen.
The flip budget of this card. Setting the heat line to its steady state gives the curve above: for each switching power, the temperature at which the die would settle (solid) and the temperature above which it runs away (dashed). The two meet at +3.1 W of switching, with the die at 82 °C: beyond that there is no equilibrium on this card's cooling, only a time to 90 °C. The long runs agree: 2.7 W (ones on 256 cores) cooled, 3.4 W (random on 128 cores) sat at 81 to 82 °C for ten minutes, 4.2 W (the checkerboard) crept to 87 °C. In flips, 3.1 W is about 10¹⁵ clocked register bits per second, or a full-load random matmul 11% of the time. The thermal resistance behind this, 1.47 °C per W, belongs to this card in this desktop chassis, which idles at 62 °C; the flip energies and the leakage belong to the chip.
9. Custom workloads: structured matrices
The point of the model is to price a workload before running it. tools/ettelem/make_tiles.py generates
structured 16×16 operand pairs: Hadamard and DCT matrices, the cosine and sine halves of a DFT, butterfly factors and their
dense kaleidoscope products (the family that generalises the fast Fourier transform), identity, banded, block-diagonal,
triangular, rank-1, circulant and 4-bit quantised matrices, a weights-times-ReLU pair, and a matrix of negative zeros. Their
tiles went through the RTL bench and the three lines of section 8, and the predictions were written down at 13:08 on
21 September (structured_predictions_before.json), before any of them had run. Fourteen then ran twice each under
the strict protocol of section 2.
- Predicted to 0.9 W rms over a 25 W range, and eleven of the fourteen to within 0.6 W, from the tiles alone.
- Structure in the values buys nothing. Kaleidoscope products, the DCT, circulant and rank-1 matrices are dense, and they cost what random normal costs (63 to 64 W): their mantissa bits are just as busy. The Hadamard matrix costs 50 W, like random signs: only the sign and the adder move.
- Structure in the zeros buys a lot. A pair of butterfly factors (two nonzeros per row, so 64 of 4,096 products survive the gating) costs 39.3 W, the identity 38.5 W, tridiagonal 40.2 W, 4×4 blocks 41.1 W, upper-triangular 44.4 W. The ReLU pair, random weights times half-zero activations, gates half its products and saves 11 of random data's 27.6 W.
- Negative zero is not zero. The gating looks for the all-zero bit pattern, so a matrix of −0.0 clocks every register: 46.7 W, the same as ones, against 38.2 W for +0.0. The model said 47.2 W. In practice: mask with a select, not by multiplying by zero, because x · 0 is −0.0 for every negative x.
- The worst miss is the DFT pair, 2.8 W low. Its products cancel almost exactly, which works the normaliser harder than any pattern the energies were fitted on; one energy for every toggle outside the multiplier tree is too coarse there.
And the heat, not just the watts. Five of the structured matrices then ran as long runs in a separate afternoon session (section 7's protocol), with the model frozen as fitted that morning, before they existed on the card. Nothing was fitted on that session: the thermal state at each launch comes from the observer of section 8, from telemetry before the launch only.
Four of the six times to 90 °C are within 3%, and the five-minute run's end temperature is off by 0.2 °C. The DFT pair is wrong by two thirds, for the same reason as its watts: 2.8 W missing out of 13 W of switching costs 47 s on a die this close to runaway. The ReLU pair is a third slow for a 1.2 W miss. Near the card's flip budget the time to a cap is a sensitive function of power, so a watt of model error matters; at full random load it does not (19.5 s predicted, 19.1 s measured). With the first-half model of section 8 instead, the same six come out at 7% in the median and 65% for the DFT pair.
$ python3 tools/ettelem/make_tiles.py kaleidoscope k.bin
$ python3 tools/ettelem/predict_heat.py --model docs/reports/data/2026-09-21-horace-aifoundry2/model.json --tiles k.bin
flips per op and minion: 4096 of 4,096 multiply-adds valid; 2.47 M register bits clocked; 74.3 M tree toggles; 13.27 M other toggles; 140 k operand-word toggles
switching power: register clocking 8.8 W, multiplier tree 2.1 W, rest of the unit 12.0 W, operand words 2.4 W, state machines 1.9 W; total 27.2 W on 1024 minions
board power at 80 C: 63.1 W (idle 35.9 W)
die temperature from an idle die at 80 C: 10 s: 86.5 C; reaches 90 C after 27 s
to hold 80 C indefinitely the card can shed 3.1 W of switching: run this workload 11% of the time
10. Method
- Kernel: hart 0 of each of 1,024 minions repeats
TensorFMA32on one 16×16×16 tile pair held in the L1 scratchpad (4,096 multiply-adds per op, 546 cycles per op for every pattern). FLOPs count one multiply and one add per multiply-add; the rate includes the gaps between launches. - Telemetry:
tools/ettelemsamples board power (10 mW steps, refreshed every 133 ms), the rail averages, the mean minion-shire temperature (whole degrees), clock and core voltage at 10 Hz. - Power "at 80 °C": the mean over seconds 1–3 of a run, moved to the start temperature with the measured leakage slope and the temperature in that window. The correction is below 0.5 W for the cool patterns and about 2 W for random data.
- RTL activity:
rtl-sim/fma_toggle(its README lists what is and is not modelled). Counts are per op and per minion, averaged over the seeds the card ran and over two points of a launch (accumulators after 10³ and 4×10⁵ ops). - Thermal network: a Foster chain with fixed time constants and non-negative resistances, fitted by least squares to the whole session (board power in, sensor reading out), skipping the first 3 minutes.
- Long runs: one process per run with the host's
--budgetraised and--stop-fileas the cap: the runner touches the file when the sensor reads 90 °C (or board power 73 W, or telemetry goes stale) and the host stops between two 0.5 s launches. The 10-second etiquette limit was waived by the card's user for these sessions; between runs the runner waits while anyone else has the card open. - Flips-to-temperature model:
tools/ettelem/flip_thermal_model.py, fitted to the long session up to the cooling change, the strict session and the idle samples of the cool starts, with the overnight idle point (62 °C, 26.7 W) as the anchor for the slowest stage. Per-run predictions start from the network state that the measured power history leaves at launch.tools/ettelem/validate_flip_model.pytests a frozen model on sessions or parts of sessions it was not fitted to, fitting nothing: it estimates the state at each launch causally and reports predicted against measured. - Results are not checked for these patterns (random sums are not exact); the same kernel is checked exactly in its integer mode, and the RTL bench checks every multiply-add against software.
cmake -S workloads/sparsity -B build/sparsity -DCMAKE_PREFIX_PATH=/opt/et -Wno-dev && cmake --build build/sparsity -j4
cmake -S tools/ettelem -B build/ettelem -DCMAKE_PREFIX_PATH=/opt/et -Wno-dev && cmake --build build/ettelem
tools/ettelem/run_horace_strict.sh build/horace3 80 84 4 5 2 7 "zeros ones pi sparse50 uniform randn" \
    "signs pow2 mant a_randn_b_ones a_ones_b_randn ternary sparse75 checker"        # about 70 minutes
make -C rtl-sim/fma_toggle && python3 rtl-sim/fma_toggle/toggles.py --tiles-dir build/horace3/tiles --out toggles.json \
    --patterns zeros,ones,pi,sparse50,uniform,randn,signs,pow2,mant,a_randn_b_ones,a_ones_b_randn,ternary,sparse75,checker
python3 tools/ettelem/analyze_horace_strict.py build/horace3 --toggles toggles.json --out horace3.json
python3 tools/ettelem/make_heating_gif.py horace3.json horace-heating.gif
tools/ettelem/run_horace_cold.sh build/horace_cold 63 300 zeros randn ones randn zeros ones   # needs a die that has idled to 62 °C
tools/ettelem/run_horace_long.sh build/horace_long tools/ettelem/horace_long.sched 80 84 90        # up to 10 min per run, 90 °C cap; 4 hours
python3 tools/ettelem/make_tiles.py --all build/structured_tiles                                   # structured operand pairs
tools/ettelem/run_ablation.sh build/ablation1 tools/ettelem/ablation.cfg 2 7                       # strict 7 s runs of any configuration
tools/ettelem/finish_horace.sh                                                                     # analyses, model, GIFs, both reports
python3 tools/ettelem/predict_heat.py --model docs/reports/data/2026-09-21-horace-aifoundry2/model.json --tiles my.bin
Raw data: docs/reports/data/2026-09-21-horace-aifoundry2/ (runs, start records, compacted 10 Hz
telemetry, the operand tiles, activity counts, analyses, the model, its predictions made before the runs). The two earlier versions of this experiment (20 September: an
uncontrolled run, then runs started at or below 80 °C) are in docs/reports/data/2026-09-20-power-aifoundry2/;
their powers agree with these to within 1.5 W, and their statement that the clock is fixed is corrected in section 6.